Houses for rent in Nederweert
See available rental houses in Nederweert below. If you are interested in renting housing from the list below, click on the headline to proceed. Good luck with your search for your new rental home! More information about rental housing in Nederweert.
Housingtarget.com today:
New today 1,290
Updated 24h 5,415
Notifications about new homes 469
Copenhagen +5
Stockholm +15
Amsterdam +7
Berlin +1
Zürich +9
Vienna +22
Paris +2
Madrid +3
Dublin (county) +4
Warsaw +1
Rome +1
Lisbon +2
Greater London +63
Latest update 2 min ago
Active ads 485,072
2 rentals
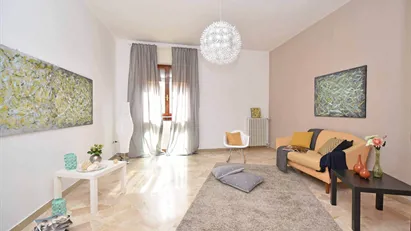
| Ca. 65 m2 house for rent in Nederweert, Limburg, Barbarastraat 2 d ago |
Ca. 65 m2 house for rent in Nederweert, Limburg, Barbarastraat
|
Ca. 65 m2 house for rent in Nederweert, Limburg, Barbarastraat
Ca. 65 m2 house for rent in Nederweert, Limburg, Barbarastraat
Ca. 65 m2
|
Ca. 65 m2 house for rent in Nederweert, Limburg, Barbarastraat
Ca. 700 EUR
|
More info |
| Ca. 175 m2 house for rent in Nederweert, Limburg, Leerlooier 19 d ago |
Ca. 175 m2 house for rent in Nederweert, Limburg, Leerlooier
|
Ca. 175 m2 house for rent in Nederweert, Limburg, Leerlooier
Ca. 175 m2 house for rent in Nederweert, Limburg, Leerlooier
Ca. 175 m2
|
Ca. 175 m2 house for rent in Nederweert, Limburg, Leerlooier
Ca. 2,200 EUR
|
More info |