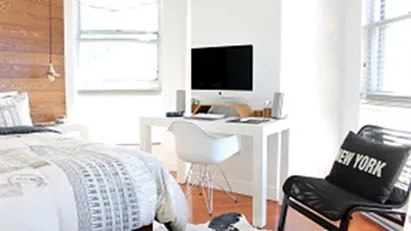
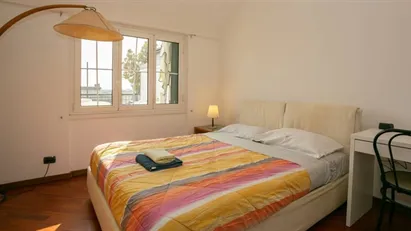
Ca. 20 m2 room for rent in Milano Zona 6 - Barona, Lorenteggio, Milan, Via Lorenteggio
34 min ago
Ca. 20 m2 room for rent in Milano Zona 6 - Barona, Lorenteggio, Milan, Via Lorenteggio
Ca. 20 m2 room for rent in Milano Zona 6 - Barona, Lorenteggio, Milan, Via Lorenteggio
Ca. 20 m2 room for rent in Milano Zona 6 - Barona, Lorenteggio, Milan, Via Lorenteggio
Ca. 20 m2
Ca. 20 m2 room for rent in Milano Zona 6 - Barona, Lorenteggio, Milan, Via Lorenteggio
More info
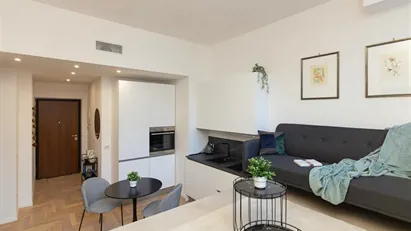
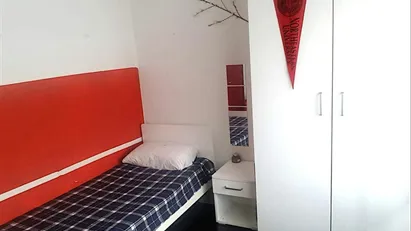
Ca. 15 m2 room for rent in Lecco, Lombardia, Via Belvedere
38 min ago
Ca. 15 m2 room for rent in Lecco, Lombardia, Via Belvedere
Ca. 15 m2 room for rent in Lecco, Lombardia, Via Belvedere
Ca. 15 m2 room for rent in Lecco, Lombardia, Via Belvedere
Ca. 15 m2
Ca. 15 m2 room for rent in Lecco, Lombardia, Via Belvedere
More info
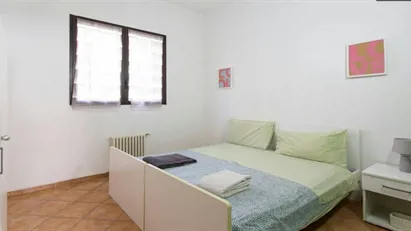
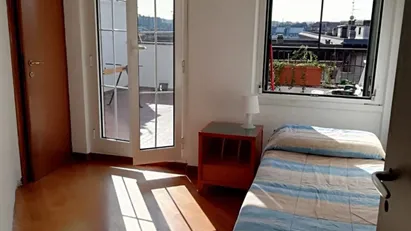
Ca. 15 m2 room for rent in Lecco, Lombardia, Via Giuseppe Resinelli
38 min ago
Ca. 15 m2 room for rent in Lecco, Lombardia, Via Giuseppe Resinelli
Ca. 15 m2 room for rent in Lecco, Lombardia, Via Giuseppe Resinelli
Ca. 15 m2 room for rent in Lecco, Lombardia, Via Giuseppe Resinelli
Ca. 15 m2
Ca. 15 m2 room for rent in Lecco, Lombardia, Via Giuseppe Resinelli
More info
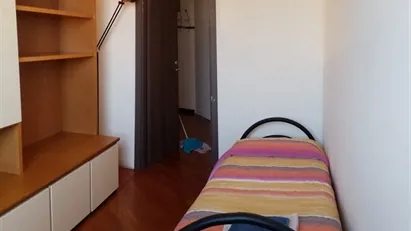
Ca. 20 m2 room for rent in Milano Zona 6 - Barona, Lorenteggio, Milan, Via Lorenteggio
41 min ago
Ca. 20 m2 room for rent in Milano Zona 6 - Barona, Lorenteggio, Milan, Via Lorenteggio
Ca. 20 m2 room for rent in Milano Zona 6 - Barona, Lorenteggio, Milan, Via Lorenteggio
Ca. 20 m2 room for rent in Milano Zona 6 - Barona, Lorenteggio, Milan, Via Lorenteggio
Ca. 20 m2
Ca. 20 m2 room for rent in Milano Zona 6 - Barona, Lorenteggio, Milan, Via Lorenteggio
More info
Ca. 15 m2 room for rent in Bergamo, Lombardia, Via Wolfgang Amadeus Mozart
43 min ago
Ca. 15 m2 room for rent in Bergamo, Lombardia, Via Wolfgang Amadeus Mozart
Ca. 15 m2 room for rent in Bergamo, Lombardia, Via Wolfgang Amadeus Mozart
Ca. 15 m2 room for rent in Bergamo, Lombardia, Via Wolfgang Amadeus Mozart
Ca. 15 m2
Ca. 15 m2 room for rent in Bergamo, Lombardia, Via Wolfgang Amadeus Mozart
More info
Ca. 15 m2 room for rent in Milano Zona 3 - Porta Venezia, Città Studi, Lambrate, Milan, Viale Abruzzi
48 min ago
Ca. 15 m2 room for rent in Milano Zona 3 - Porta Venezia, Città Studi, Lambrate, Milan, Viale Abruzzi
Ca. 15 m2 room for rent in Milano Zona 3 - Porta Venezia, Città Studi, Lambrate, Milan, Viale Abruzzi
Ca. 15 m2 room for rent in Milano Zona 3 - Porta Venezia, Città Studi, Lambrate, Milan, Viale Abruzzi
Ca. 15 m2
Ca. 15 m2 room for rent in Milano Zona 3 - Porta Venezia, Città Studi, Lambrate, Milan, Viale Abruzzi
More info
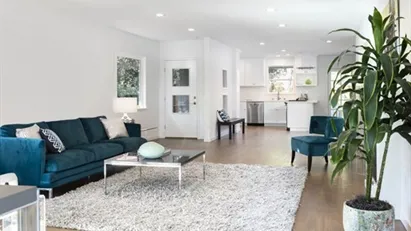
Ca. 60 m2 apartment for rent in Milano Zona 8 - Fiera, Gallaratese, Quarto Oggiaro, Milan, Via Raffaello Sanzio
57 min ago
Ca. 60 m2 apartment for rent in Milano Zona 8 - Fiera, Gallaratese, Quarto Oggiaro, Milan, Via Raffaello Sanzio
Ca. 60 m2 apartment for rent in Milano Zona 8 - Fiera, Gallaratese, Quarto Oggiaro, Milan, Via Raffaello Sanzio
Ca. 60 m2 apartment for rent in Milano Zona 8 - Fiera, Gallaratese, Quarto Oggiaro, Milan, Via Raffaello Sanzio
Ca. 60 m2 Rooms 1
Ca. 60 m2 apartment for rent in Milano Zona 8 - Fiera, Gallaratese, Quarto Oggiaro, Milan, Via Raffaello Sanzio
More info
Ca. 130 m2 apartment for rent in Milano Zona 9 - Porta Garibaldi, Niguarda, Milan, Via Luigi Ornato
57 min ago
Ca. 130 m2 apartment for rent in Milano Zona 9 - Porta Garibaldi, Niguarda, Milan, Via Luigi Ornato
Ca. 130 m2 apartment for rent in Milano Zona 9 - Porta Garibaldi, Niguarda, Milan, Via Luigi Ornato
Ca. 130 m2 apartment for rent in Milano Zona 9 - Porta Garibaldi, Niguarda, Milan, Via Luigi Ornato
Ca. 130 m2 Rooms 2
Ca. 130 m2 apartment for rent in Milano Zona 9 - Porta Garibaldi, Niguarda, Milan, Via Luigi Ornato
More info
Ca. 55 m2 apartment for rent in Milano Zona 9 - Porta Garibaldi, Niguarda, Milan, Via Carlo Imbonati
58 min ago
Ca. 55 m2 apartment for rent in Milano Zona 9 - Porta Garibaldi, Niguarda, Milan, Via Carlo Imbonati
Ca. 55 m2 apartment for rent in Milano Zona 9 - Porta Garibaldi, Niguarda, Milan, Via Carlo Imbonati
Ca. 55 m2 apartment for rent in Milano Zona 9 - Porta Garibaldi, Niguarda, Milan, Via Carlo Imbonati
Ca. 55 m2 Rooms 1
Ca. 55 m2 apartment for rent in Milano Zona 9 - Porta Garibaldi, Niguarda, Milan, Via Carlo Imbonati
More info
Ca. 100 m2 apartment for rent in Milano Zona 9 - Porta Garibaldi, Niguarda, Milan, Via Carlo Farini
59 min ago
Ca. 100 m2 apartment for rent in Milano Zona 9 - Porta Garibaldi, Niguarda, Milan, Via Carlo Farini
Ca. 100 m2 apartment for rent in Milano Zona 9 - Porta Garibaldi, Niguarda, Milan, Via Carlo Farini
Ca. 100 m2 apartment for rent in Milano Zona 9 - Porta Garibaldi, Niguarda, Milan, Via Carlo Farini
Ca. 100 m2 Rooms 2
Ca. 100 m2 apartment for rent in Milano Zona 9 - Porta Garibaldi, Niguarda, Milan, Via Carlo Farini
More info
Ca. 40 m2 apartment for rent in Milano Zona 4 - Vittoria, Forlanini, Milan, Via Val Strona
1 h ago
Ca. 40 m2 apartment for rent in Milano Zona 4 - Vittoria, Forlanini, Milan, Via Val Strona
Ca. 40 m2 apartment for rent in Milano Zona 4 - Vittoria, Forlanini, Milan, Via Val Strona
Ca. 40 m2 apartment for rent in Milano Zona 4 - Vittoria, Forlanini, Milan, Via Val Strona
Ca. 40 m2 Rooms 1
Ca. 40 m2 apartment for rent in Milano Zona 4 - Vittoria, Forlanini, Milan, Via Val Strona
More info
Ca. 65 m2 apartment for rent in Milano Zona 6 - Barona, Lorenteggio, Milan, Via Ettore Ponti
1 h ago
Ca. 65 m2 apartment for rent in Milano Zona 6 - Barona, Lorenteggio, Milan, Via Ettore Ponti
Ca. 65 m2 apartment for rent in Milano Zona 6 - Barona, Lorenteggio, Milan, Via Ettore Ponti
Ca. 65 m2 apartment for rent in Milano Zona 6 - Barona, Lorenteggio, Milan, Via Ettore Ponti
Ca. 65 m2 Rooms 3
Ca. 65 m2 apartment for rent in Milano Zona 6 - Barona, Lorenteggio, Milan, Via Ettore Ponti
More info
Ca. 60 m2 apartment for rent in Milano Zona 2 - Stazione Centrale, Gorla, Turro, Greco, Crescenzago, Milan, Via Comune Antico
1 h ago
Ca. 60 m2 apartment for rent in Milano Zona 2 - Stazione Centrale, Gorla, Turro, Greco, Crescenzago, Milan, Via Comune Antico
Ca. 60 m2 apartment for rent in Milano Zona 2 - Stazione Centrale, Gorla, Turro, Greco, Crescenzago, Milan, Via Comune Antico
Ca. 60 m2 apartment for rent in Milano Zona 2 - Stazione Centrale, Gorla, Turro, Greco, Crescenzago, Milan, Via Comune Antico
Ca. 60 m2 Rooms 1
Ca. 60 m2 apartment for rent in Milano Zona 2 - Stazione Centrale, Gorla, Turro, Greco, Crescenzago, Milan, Via Comune Antico
More info
Ca. 80 m2 apartment for rent in Milano Zona 2 - Stazione Centrale, Gorla, Turro, Greco, Crescenzago, Milan, Via Giancarlo Puecher
1 h ago
Ca. 80 m2 apartment for rent in Milano Zona 2 - Stazione Centrale, Gorla, Turro, Greco, Crescenzago, Milan, Via Giancarlo Puecher
Ca. 80 m2 apartment for rent in Milano Zona 2 - Stazione Centrale, Gorla, Turro, Greco, Crescenzago, Milan, Via Giancarlo Puecher
Ca. 80 m2 apartment for rent in Milano Zona 2 - Stazione Centrale, Gorla, Turro, Greco, Crescenzago, Milan, Via Giancarlo Puecher
Ca. 80 m2 Rooms 3
Ca. 80 m2 apartment for rent in Milano Zona 2 - Stazione Centrale, Gorla, Turro, Greco, Crescenzago, Milan, Via Giancarlo Puecher
More info
Ca. 10 m2 room for rent in Milano Zona 6 - Barona, Lorenteggio, Milan, Viale Liguria
1 h ago
Ca. 10 m2 room for rent in Milano Zona 6 - Barona, Lorenteggio, Milan, Viale Liguria
Ca. 10 m2 room for rent in Milano Zona 6 - Barona, Lorenteggio, Milan, Viale Liguria
Ca. 10 m2 room for rent in Milano Zona 6 - Barona, Lorenteggio, Milan, Viale Liguria
Ca. 10 m2
Ca. 10 m2 room for rent in Milano Zona 6 - Barona, Lorenteggio, Milan, Viale Liguria
More info
Room for rent in Milano Zona 5 - Vigentino, Chiaravalle, Gratosoglio, Milan, Via Bordighera
1 h ago
Room for rent in Milano Zona 5 - Vigentino, Chiaravalle, Gratosoglio, Milan, Via Bordighera
Room for rent in Milano Zona 5 - Vigentino, Chiaravalle, Gratosoglio, Milan, Via Bordighera
Room for rent in Milano Zona 5 - Vigentino, Chiaravalle, Gratosoglio, Milan, Via Bordighera
Room for rent in Milano Zona 5 - Vigentino, Chiaravalle, Gratosoglio, Milan, Via Bordighera
More info
Room for rent in Milano Zona 2 - Stazione Centrale, Gorla, Turro, Greco, Crescenzago, Milan, Via Giancarlo Puecher
1 h ago
Room for rent in Milano Zona 2 - Stazione Centrale, Gorla, Turro, Greco, Crescenzago, Milan, Via Giancarlo Puecher
Room for rent in Milano Zona 2 - Stazione Centrale, Gorla, Turro, Greco, Crescenzago, Milan, Via Giancarlo Puecher
Room for rent in Milano Zona 2 - Stazione Centrale, Gorla, Turro, Greco, Crescenzago, Milan, Via Giancarlo Puecher
Room for rent in Milano Zona 2 - Stazione Centrale, Gorla, Turro, Greco, Crescenzago, Milan, Via Giancarlo Puecher
More info