Apartment for rent in Bad Fischau-Brunn, Niederösterreich, , Stadionstraße
1 mo ago
Apartment for rent in Bad Fischau-Brunn, Niederösterreich, , Stadionstraße
Apartment for rent in Bad Fischau-Brunn, Niederösterreich, , Stadionstraße
Apartment for rent in Bad Fischau-Brunn, Niederösterreich, , Stadionstraße
Rooms 3
Apartment for rent in Bad Fischau-Brunn, Niederösterreich, , Stadionstraße
More info
Apartment for rent in Bad Fischau-Brunn, Niederösterreich, , Stadionstraße
1 mo ago
Apartment for rent in Bad Fischau-Brunn, Niederösterreich, , Stadionstraße
Apartment for rent in Bad Fischau-Brunn, Niederösterreich, , Stadionstraße
Apartment for rent in Bad Fischau-Brunn, Niederösterreich, , Stadionstraße
Rooms 3
Apartment for rent in Bad Fischau-Brunn, Niederösterreich, , Stadionstraße
More info
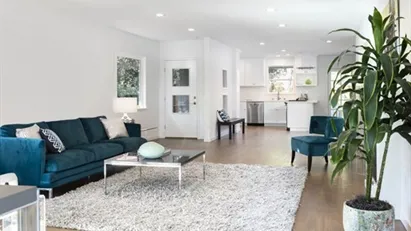
Ca. 70 m2 apartment for rent in Bad Fischau-Brunn, Niederösterreich, Stadionstraße
15 d ago
Ca. 70 m2 apartment for rent in Bad Fischau-Brunn, Niederösterreich, Stadionstraße
Ca. 70 m2 apartment for rent in Bad Fischau-Brunn, Niederösterreich, Stadionstraße
Ca. 70 m2 apartment for rent in Bad Fischau-Brunn, Niederösterreich, Stadionstraße
Ca. 70 m2 Rooms 3
Ca. 70 m2 apartment for rent in Bad Fischau-Brunn, Niederösterreich, Stadionstraße
More info
Ca. 70 m2 apartment for rent in Bad Fischau-Brunn, Niederösterreich, Stadionstraße
15 d ago
Ca. 70 m2 apartment for rent in Bad Fischau-Brunn, Niederösterreich, Stadionstraße
Ca. 70 m2 apartment for rent in Bad Fischau-Brunn, Niederösterreich, Stadionstraße
Ca. 70 m2 apartment for rent in Bad Fischau-Brunn, Niederösterreich, Stadionstraße
Ca. 70 m2 Rooms 3
Ca. 70 m2 apartment for rent in Bad Fischau-Brunn, Niederösterreich, Stadionstraße
More info
Ca. 75 m2 apartment for rent in Bad Fischau-Brunn, Niederösterreich, Stadionstraße
15 d ago
Ca. 75 m2 apartment for rent in Bad Fischau-Brunn, Niederösterreich, Stadionstraße
Ca. 75 m2 apartment for rent in Bad Fischau-Brunn, Niederösterreich, Stadionstraße
Ca. 75 m2 apartment for rent in Bad Fischau-Brunn, Niederösterreich, Stadionstraße
Ca. 75 m2 Rooms 3
Ca. 75 m2 apartment for rent in Bad Fischau-Brunn, Niederösterreich, Stadionstraße
More info
Apartment for rent in Bad Fischau-Brunn, Niederösterreich, , Stadionstraße
1 mo ago
Apartment for rent in Bad Fischau-Brunn, Niederösterreich, , Stadionstraße
Apartment for rent in Bad Fischau-Brunn, Niederösterreich, , Stadionstraße
Apartment for rent in Bad Fischau-Brunn, Niederösterreich, , Stadionstraße
Rooms 3
Apartment for rent in Bad Fischau-Brunn, Niederösterreich, , Stadionstraße
More info
Apartment for rent in Bad Fischau-Brunn, Niederösterreich, , Stadionstraße
1 mo ago
Apartment for rent in Bad Fischau-Brunn, Niederösterreich, , Stadionstraße
Apartment for rent in Bad Fischau-Brunn, Niederösterreich, , Stadionstraße
Apartment for rent in Bad Fischau-Brunn, Niederösterreich, , Stadionstraße
Rooms 3
Apartment for rent in Bad Fischau-Brunn, Niederösterreich, , Stadionstraße
More info
Ca. 70 m2 apartment for rent in Bad Fischau-Brunn, Niederösterreich, Stadionstraße
15 d ago
Ca. 70 m2 apartment for rent in Bad Fischau-Brunn, Niederösterreich, Stadionstraße
Ca. 70 m2 apartment for rent in Bad Fischau-Brunn, Niederösterreich, Stadionstraße
Ca. 70 m2 apartment for rent in Bad Fischau-Brunn, Niederösterreich, Stadionstraße
Ca. 70 m2 Rooms 3
Ca. 70 m2 apartment for rent in Bad Fischau-Brunn, Niederösterreich, Stadionstraße
More info
Ca. 75 m2 apartment for rent in Bad Fischau-Brunn, Niederösterreich, Stadionstraße
15 d ago
Ca. 75 m2 apartment for rent in Bad Fischau-Brunn, Niederösterreich, Stadionstraße
Ca. 75 m2 apartment for rent in Bad Fischau-Brunn, Niederösterreich, Stadionstraße
Ca. 75 m2 apartment for rent in Bad Fischau-Brunn, Niederösterreich, Stadionstraße
Ca. 75 m2 Rooms 3
Ca. 75 m2 apartment for rent in Bad Fischau-Brunn, Niederösterreich, Stadionstraße
More info
Apartment for rent in Bad Fischau-Brunn, Niederösterreich, , Stadionstraße
1 mo ago
Apartment for rent in Bad Fischau-Brunn, Niederösterreich, , Stadionstraße
Apartment for rent in Bad Fischau-Brunn, Niederösterreich, , Stadionstraße
Apartment for rent in Bad Fischau-Brunn, Niederösterreich, , Stadionstraße
Rooms 2
Apartment for rent in Bad Fischau-Brunn, Niederösterreich, , Stadionstraße
More info
Ca. 20 m2 apartment for rent in Bad Fischau-Brunn, Niederösterreich, Street not specified
3 d ago
Ca. 20 m2 apartment for rent in Bad Fischau-Brunn, Niederösterreich, Street not specified
Ca. 20 m2 apartment for rent in Bad Fischau-Brunn, Niederösterreich, Street not specified
Ca. 20 m2 apartment for rent in Bad Fischau-Brunn, Niederösterreich, Street not specified
Ca. 20 m2 Rooms 1
Ca. 20 m2 apartment for rent in Bad Fischau-Brunn, Niederösterreich, Street not specified
More info
Ca. 30 m2 apartment for rent in Bad Fischau-Brunn, Niederösterreich, Street not specified
3 d ago
Ca. 30 m2 apartment for rent in Bad Fischau-Brunn, Niederösterreich, Street not specified
Ca. 30 m2 apartment for rent in Bad Fischau-Brunn, Niederösterreich, Street not specified
Ca. 30 m2 apartment for rent in Bad Fischau-Brunn, Niederösterreich, Street not specified
Ca. 30 m2 Rooms 1
Ca. 30 m2 apartment for rent in Bad Fischau-Brunn, Niederösterreich, Street not specified
More info
Ca. 80 m2 apartment for rent in Bad Fischau-Brunn, Niederösterreich, Stadionstraße
2 mo ago
Ca. 80 m2 apartment for rent in Bad Fischau-Brunn, Niederösterreich, Stadionstraße
Ca. 80 m2 apartment for rent in Bad Fischau-Brunn, Niederösterreich, Stadionstraße
Ca. 80 m2 apartment for rent in Bad Fischau-Brunn, Niederösterreich, Stadionstraße
Ca. 80 m2 Rooms 3
Ca. 80 m2 apartment for rent in Bad Fischau-Brunn, Niederösterreich, Stadionstraße
More info